Ofcom
|
|
Latest telecoms and pay-TV complaints figures revealed
We’ve yesterday published the latest figures for complaints we’ve received about the UK’s major providers of landline, mobile, broadband and pay-TV services.
These figures cover the quarter from April to June this year.
During that quarter, complaints remained at a similar level to the previous quarter. Complaints about broadband, landline and mobile services fell slightly while complaints about pay-TV services stayed the same.
Main findings
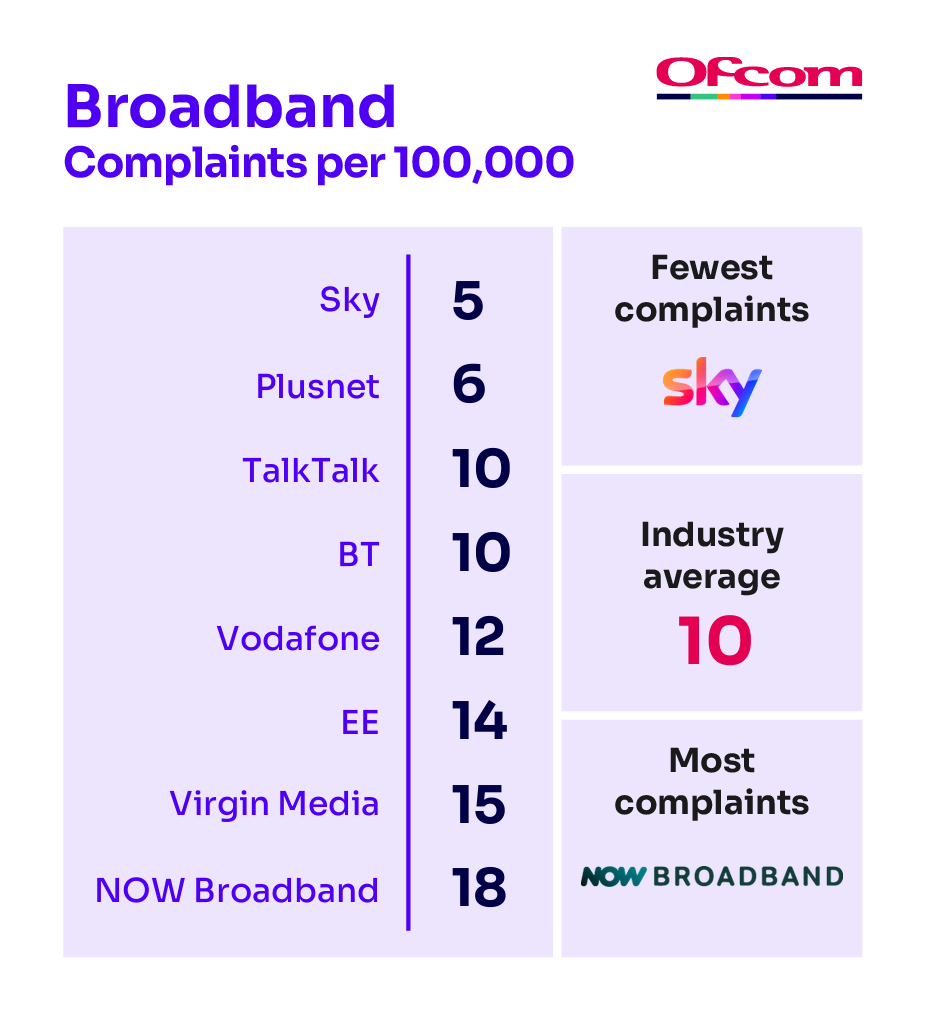
- NOW Broadband generated the most complaints about broadband services, although complaints about it did fall from the previous quarter. Complaints were mostly driven by how it had handled customers’ complaints.
- Sky was the least complained-about broadband provider.
- EE was the most complained-about landline provider, with complaints increasing on the previous quarter. Customers mostly complained about faults, services and getting their connections set up.
- Utility Warehouse generated the fewest landline complaints.
- O2 was the most complained-about mobile provider. Customer complaints were primarily driven by how O2 had handled their complaints.
- EE, Tesco Mobile and Vodafone were the least complained-about mobile providers.
- EE and Virgin Media were the most complained-about pay-TV providers, while Sky and TalkTalk were the pay-TV providers who generated the fewest complaints.
Fergal Farragher, Ofcom’s Policy Director, yesterday said:
“While complaints numbers remained broadly the same during this quarter, we’re pleased to see slight falls in complaints across some of the services covered by these figures.
“Communications services are now essential to our daily lives and customers deserve a high level of service. We call on providers to improve their performance in areas in which they are currently falling short.”
As the UK’s communications regulator, these complaints figures help us to better understand the reasons for customers’ dissatisfaction across these services. While we don’t deal with individual complaints, publishing these figures helps consumers to identify the best provider for their needs.
The tables below show the numbers of complaints we’ve received for broadband, landline, pay-monthly mobile and pay-TV services.

¼ Broadband complaints per 100,000 subscribers. It illustrates the providers receiving the fewest complaints at the top of the table and those receiving the most complaints are placed at the bottom of the table.
Original article link: https://www.ofcom.org.uk/phones-and-broadband/service-quality/latest-telecoms-and-pay-tv-complaints-figures-revealed2/


